Fast implementation of hazard, cumulative hazard, ... for mixtures of subpopulations
Source:R/pch_functions_mixture.R
mixture_haz_fun.RdFast implementation of hazard, cumulative hazard, ... for mixtures of subpopulations
Usage
mixture_haz_fun(p, pdfs, survs)

mixture_cumhaz_fun(p, survs)

mixture_cdf_fun(p, cdfs)

mixture_pdf_fun(p, pdfs)

mixture_surv_fun(p, survs)

mixture_quant_fun(p, cdfs, quants)

mixture_rng_fun(p, rngs)
Arguments
- p
vector of probabilities of the mixture
- pdfs
list of probability density functions of the mixture components
- survs
list of survuval functions of the mixture components
- cdfs
list of cumulative density functions of the mixture components
- quants
list of quantile functions of the mixture components
- rngs
random number generating functions of the components
Value
A function with one parameter, a vector of times/probabilities where the function should be evaluated.
Details
the last time interval extends to +Inf
mixture_quant_fun relies on numeric root finding and is therefore not as fast as miniPCH::qpch_fun.
mixture_rng samples the counts from the respective mixtures from
a multinomial distribution with parameter p and then samples from the
components and shuffles the result.
Functions
mixture_haz_fun(): hazard function of mixturemixture_cumhaz_fun(): cumulative hazard function of mixturemixture_cdf_fun(): cumulative density function of mixturemixture_pdf_fun(): probability density function of mixturemixture_surv_fun(): survival function of mixturemixture_quant_fun(): quantile function of mixturemixture_rng_fun(): quantile function of mixture
Examples
haz <- mixture_haz_fun(
  p = c(0.3, 0.7),
  pdfs = list(
    miniPCH::dpch_fun(0, 0.1),
    miniPCH::dpch_fun(c(0,5), c(0.1, 0.12))
  ),
  survs = list(
    miniPCH::spch_fun(0, 0.1),
    miniPCH::spch_fun(c(0,5), c(0.1, 0.12))
  )
)
plot(haz(seq(0, 30, by=0.15)), ylim=c(0, 0.2), type="l")
abline(h=0)

cumhaz <- mixture_cumhaz_fun(
  p = c(0.3, 0.7),
  survs = list(
    miniPCH::spch_fun(0, 0.1),
    miniPCH::spch_fun(c(0,5), c(0.1, 0.12))
  )
)
plot(cumhaz(seq(0, 30, by=0.15)), type="l")

cdf <- mixture_cdf_fun(
  p = c(0.3, 0.7),
  cdfs = list(
    miniPCH::ppch_fun(0, 0.1),
    miniPCH::ppch_fun(c(0,5), c(0.1, 0.12))
  )
)
plot(cdf(seq(0, 30, by=0.15)), type="l")

pdf <- mixture_pdf_fun(
  p = c(0.3, 0.7),
  pdfs = list(
    miniPCH::dpch_fun(0, 0.1),
    miniPCH::dpch_fun(c(0,5), c(0.1, 0.12))
  )
)
plot(pdf(seq(0, 30, by=0.15)), type="l")

surv <- mixture_surv_fun(
  p = c(0.3, 0.7),
  survs = list(
    miniPCH::spch_fun(0, 0.1),
    miniPCH::spch_fun(c(0,5), c(0.1, 0.12))
  )
)
plot(surv(seq(0, 30, by=0.15)), type="l")


quant <- mixture_quant_fun(
  p = c(0.3, 0.7),
  cdfs = list(
    miniPCH::ppch_fun(0, 0.1),
    miniPCH::ppch_fun(c(0,5), c(0.1, 0.12))
  ),
  quants = list(
    miniPCH::qpch_fun(0, 0.1),
    miniPCH::qpch_fun(c(0,5), c(0.1, 0.12))
  )
)

x <- seq(0, 1, by=0.015)
plot(x, quant(x), type="l")

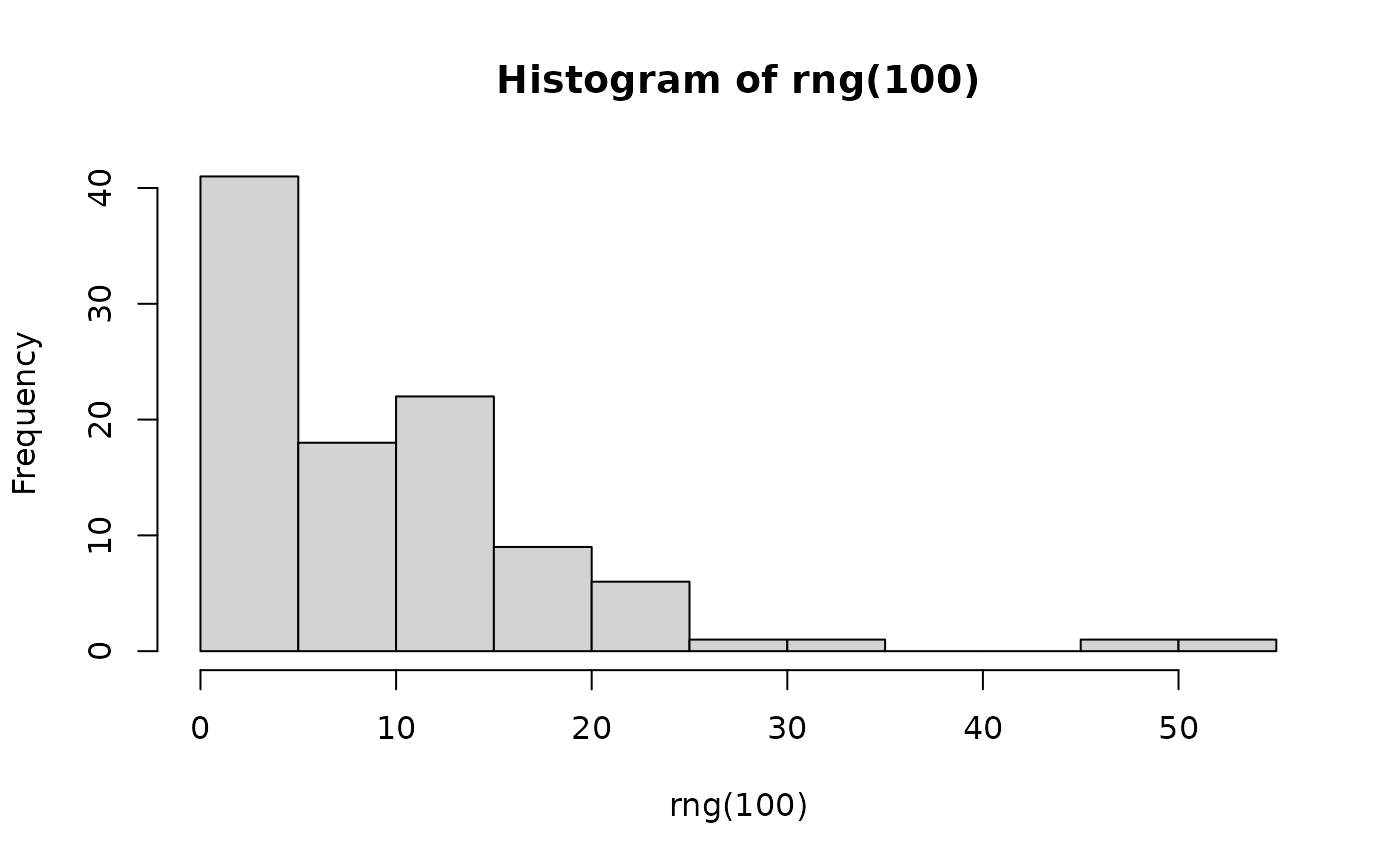
rng <- mixture_rng_fun(
  p = c(0.3, 0.7),
  rngs = list(
    miniPCH::rpch_fun(0, 0.1, discrete = TRUE),
    miniPCH::rpch_fun(c(0,5), c(0.1, 0.12), discrete = TRUE)
  )
)
hist(rng(100))
