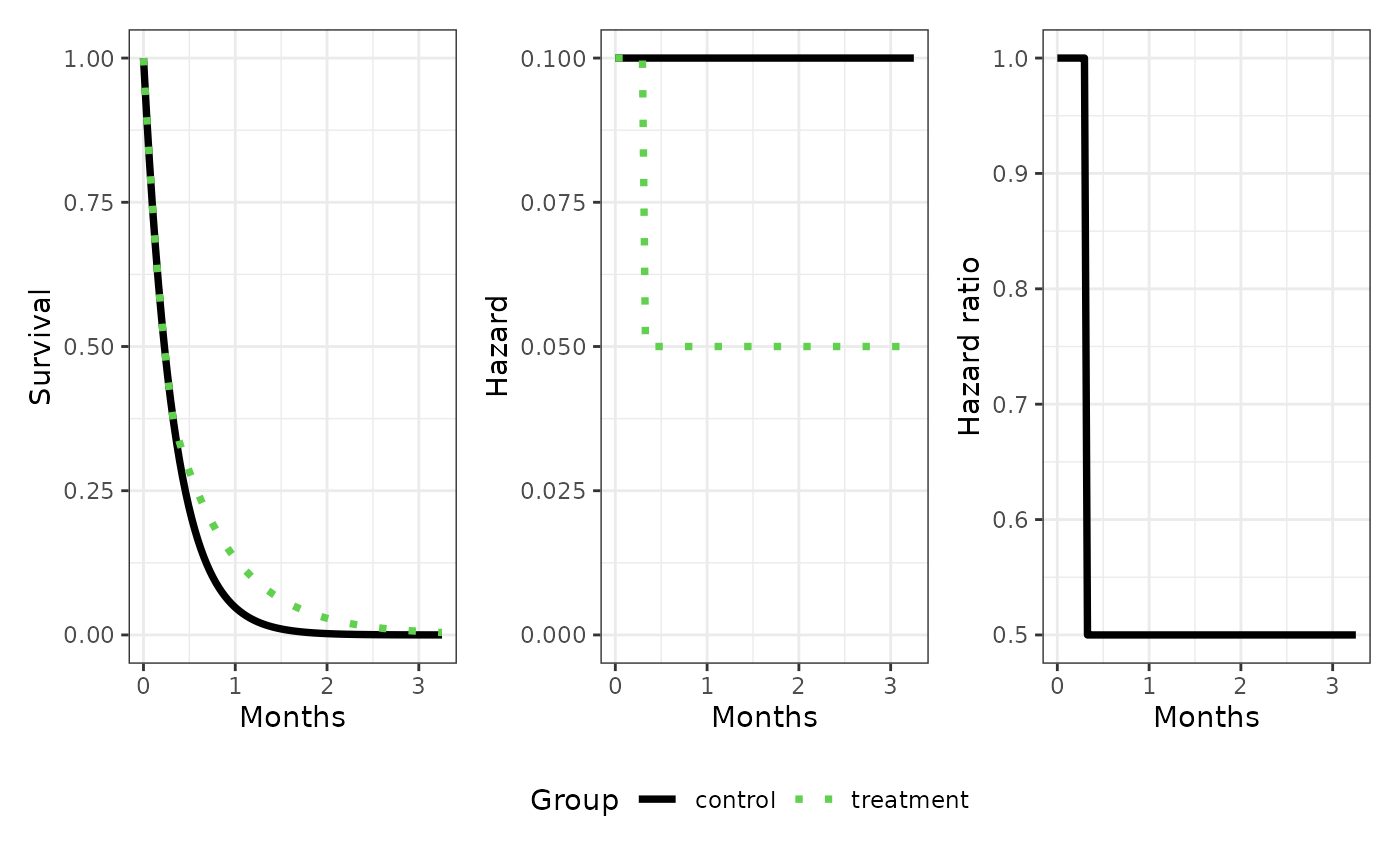
Plot of survival, hazard and hazard ratio of two groups as a function of time using ggplot and patchwork
Source:R/shhr_gg.R
shhr_gg.RdPlot of survival, hazard and hazard ratio of two groups as a function of time using ggplot and patchwork
Arguments
- A
mixpch object for group 1 (reference)
- B
mixpch object for group 2
- main
Title for the overall plot
- sub
Subtitle for the overall plot
- group_names
Group Names
- lab_time
Title for the time axis
- lab_group
Title group legend
- trafo_time
Function to transform time
- colours
vector of two colours
- linetypes
vector of two linetypes
- linewidths
vector of two linewidths
- as_list
return a list of ggplot objects instead of a patchwork object
Value
a patchwork object as defined in the patchwork package or a list of
ggplot objects if as_list=TRUE.